© 2026. Randolph Hub. All Rights Reserved.
Welcome!
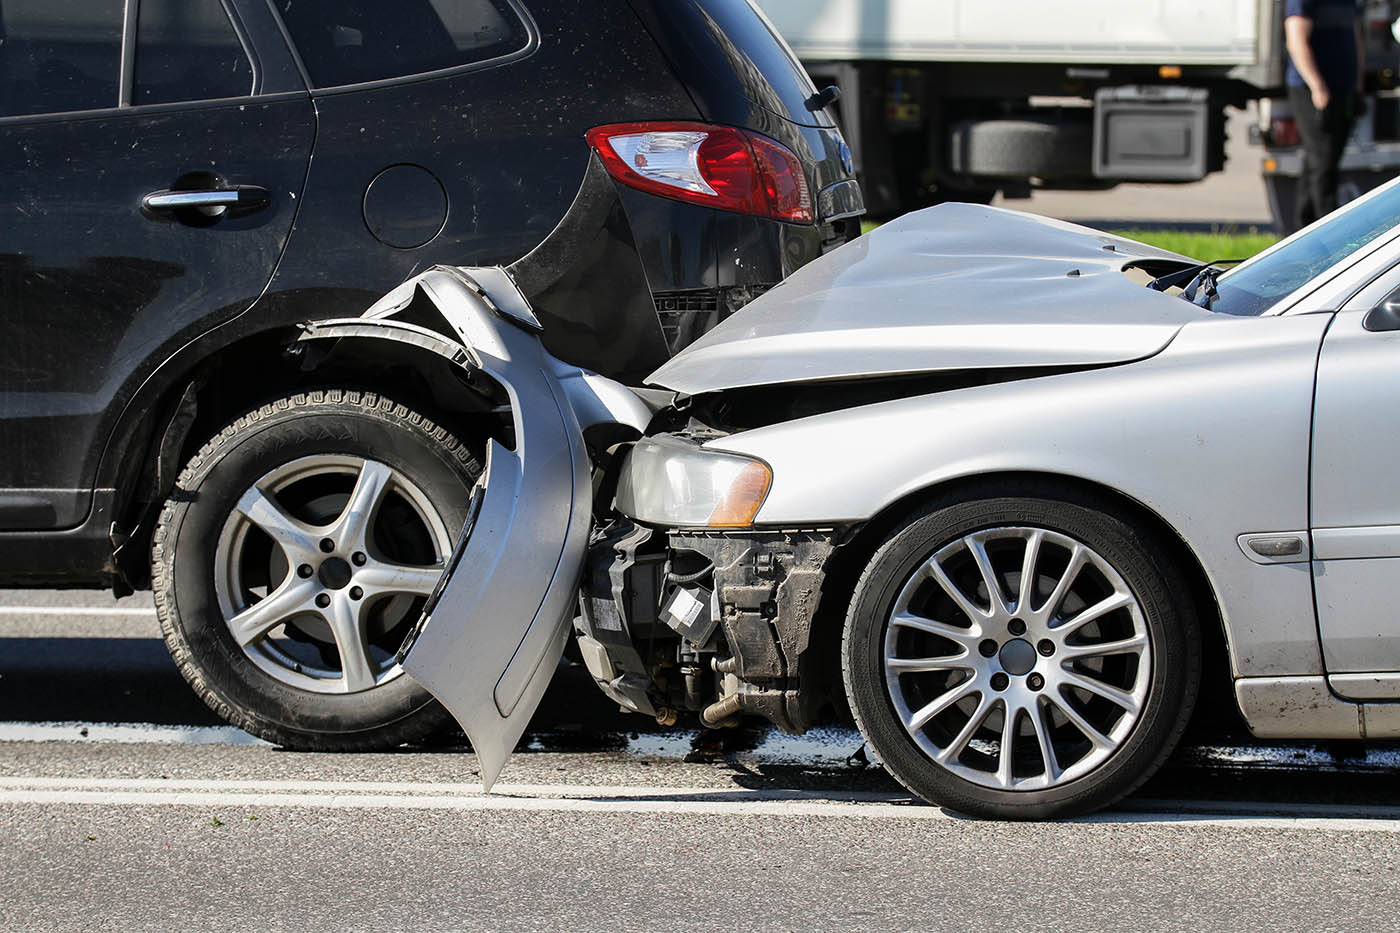
(Ingus_Evertovskis / Adobe Stock)
What We Found in Asheboro Crash Data
ASHEBORO N.C. — Between January 2020 and May 2025, Officers with the Asheboro Police Department responded to 7,518 crashes — about one every 6 hours, 16 minutes, or about 3.8 crashes per day. Through data obtained through public records requests, and with the assistance of the staff in the records department, we took a look at the thousands of crashes and this is what stood out.
Crashes (so far) are not up this year.
So far in 2025, the total number of crashes is what we expect based on the past four years.
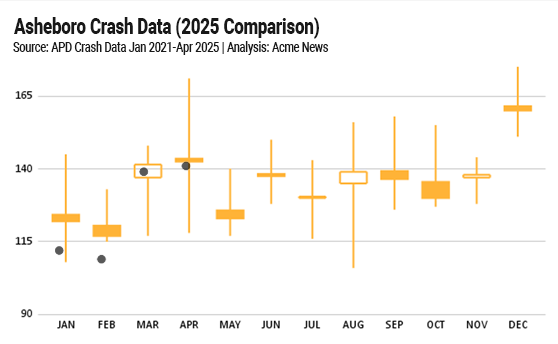
Asheboro Crashes Are Remarkably Consistent Over Time
.png)
Zooming out and looking at the larger picture, traffic crashes in Asheboro have been remarkably consistent over the past four years. On average, Asheboro sees about 1,627.5 crashes each year, covering everything from minor fender-benders in parking lots and animal collisions to serious head-on crashes on the interstate.
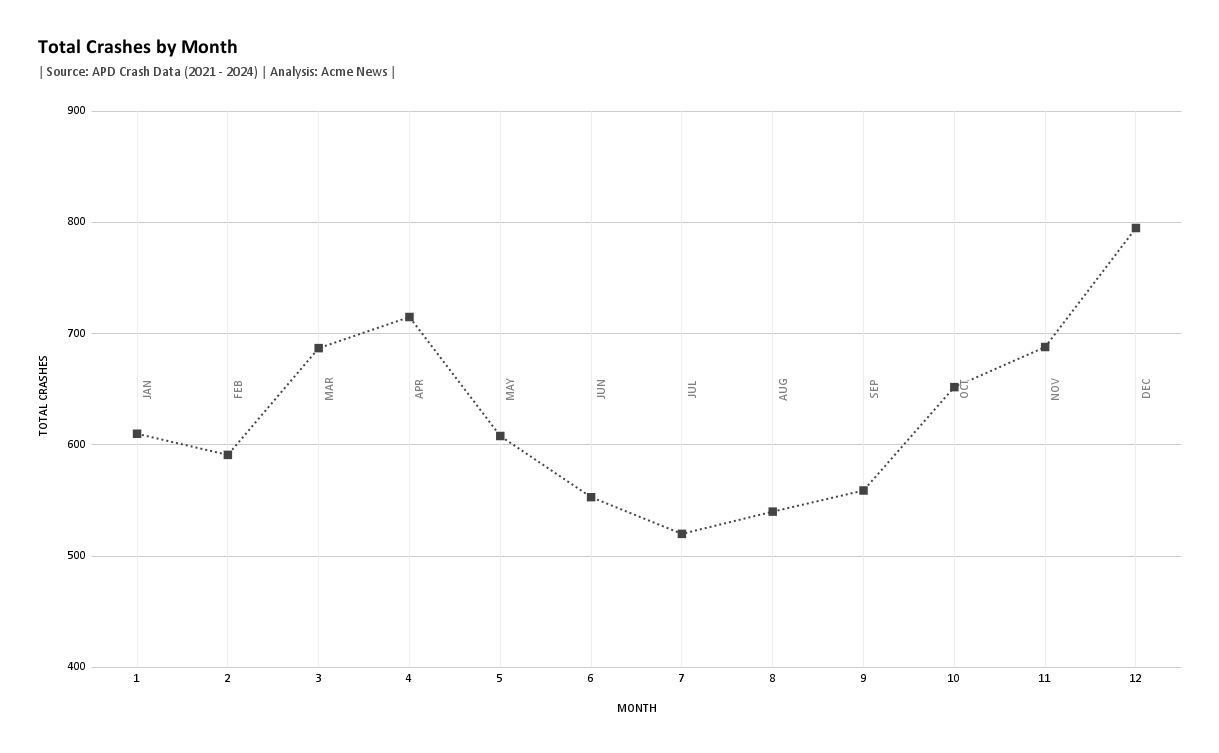
There are typically spikes in the number of crashes in both the early spring months of March and April, as well as at the end of the year from October through December, but overall the trend shows little movement.
The Types of Crashes (How Crashes Happen)
Using specific reporting boxes on the NCDOT crash form, we can break down crashes by type.
.png)
Where are the hot spots?
When it comes to total crashes, unsurprisingly, US-64 accounts for the most crashes, 12.9% of all crashes. US 220 Business ranks second with 9.7%, followed by NC-42 (5.3%) and I-73/74 (4%).
One location that can’t go without mentioning is Center Pointe Plaza, which includes both the Walmart shopping center (and possibly its adjoining intersection), which alone accounts for 4.3% of all crashes in Asheboro.
Oh Deer! What about animal collisions?
Crashes involving animals follow a clear seasonal pattern, spiking in the later months of the year. Over the past four years, November saw the highest number of animal collisions with 52 incidents, followed by October (30) and December (21).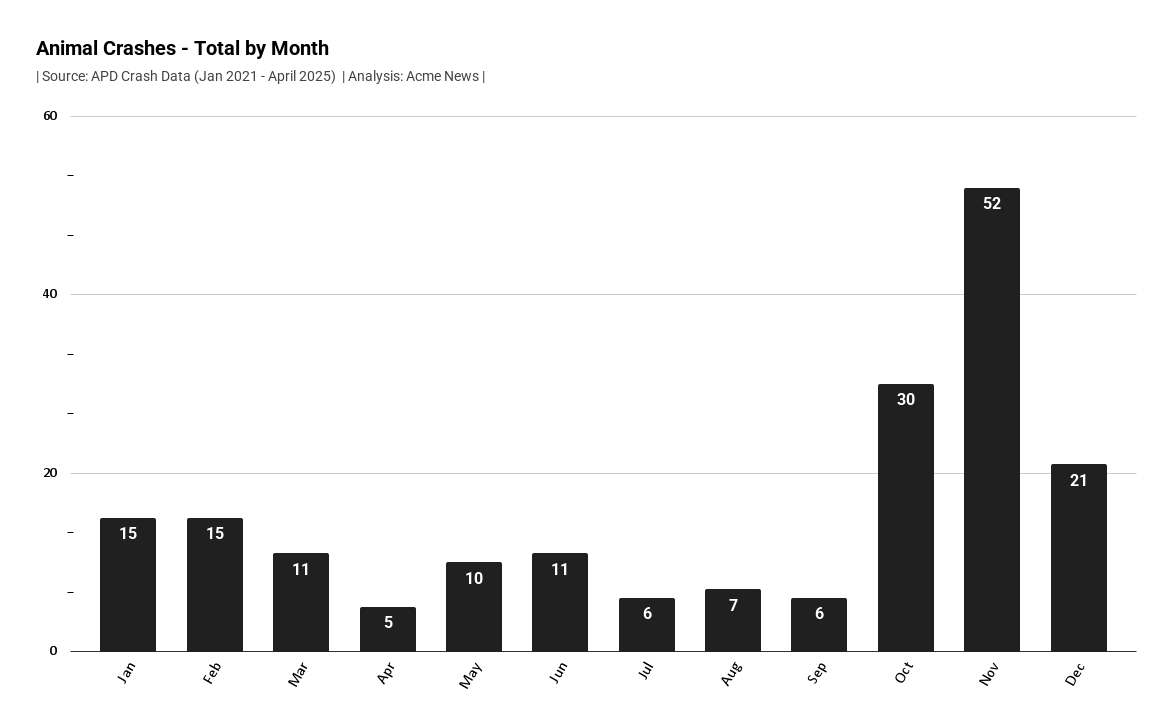
November’s spike in crashes might seem odd at first — after all, when you look at total crash numbers, the peak is in December, not November. But the likely explanation lies in the shift from daylight savings to standard time.
When daylight saving time ended on Nov. 2, 2024, sunset jumped from 6:22 p.m to 5:22 p.m. overnight. Those darker hours combined with the fact that 34% of all animal crashes take place between 6–10 p.m. likely led to this spike, but it could also be explained by a combination of several other factors.
There is also a spike in animal collisions during the morning commute — between 5 a.m. and 8 a.m., which accounts for 20.6% of all animal crashes.
Location-wise, certain roads see more animal-related crashes than others:
- 15.3% on I-73/74
- 10% on US 220 Business
- 5% on US-64
- 4% on East and West Central Avenue
More to come — This article offers an early look at Acme News’ analysis of crash data trends in and around Asheboro. It’s part of a larger project aimed at using data to better understand our community. Readers of the Randolph Hub get this exclusive first look, and we’ll be sharing more in the weeks ahead. Have a question you think the data might answer? Or an idea for something we should dig into? Visit https://acmenews.net for the full breakdown when it’s available—and to find out how to get in touch.